© 2025 IggyCloud JThemes.com
- Home
- Articles
- Performance Tests
- K6 Performance Testing: Find Your API Breaking Point Before Users Do
K6 Performance Testing: Find Your API Breaking Point Before Users Do
K6 Performance Testing: Find Your API Breaking Point Before Users Do
Discover how many users your API can handle with K6 load testing in just 3 simple commandsThe Performance Testing Blind Spot
After deploying countless APIs to production, I’ve discovered three critical questions most developers can’t answer: ❌ Unknown Capacity – How many concurrent users can your system actually handle? ❌ No SLA Validation – Can you meet your 99% response time requirements under load? ❌ Invisible Breaking Point – Where exactly does your system performance explode? New to performance testing? This episode covers K6 fundamentals, different testing models, and finding your system’s limits through hands-on demonstrations.The K6 Solution: Developer-Friendly Load Testing
Test your APIs with K6 by Grafana Labs:- ✅ JavaScript-based tests – Write tests in familiar JavaScript syntax
- ✅ Multiple testing models – Load, spike, stress, and endurance testing
- ✅ Built-in thresholds – Define SLA requirements directly in tests
- ✅ Real-time results – Immediate feedback on system performance
- ✅ Open source and free – No licensing costs or restrictions
Three Essential K6 Commands
Your complete performance testing workflow in three simple commands:🚀 Complete K6 Testing Sequence
# 1. Install K6 (macOS/Linux)
brew install k6

# 2. Run your performance test
k6 run performance-test.js

# 3. Export results for analysis
k6 run --summary-export=results.json performance-test.js- Execute your JavaScript-based performance tests
- Generate real-time metrics and results
- Validate SLA thresholds and requirements
- Export detailed performance data
Step-by-Step Implementation
Prerequisites
- Node.js and npm installed
- Running API to test
- Kubernetes cluster (optional, for resource limiting)
1. Install K6
Choose your platform and install K6:# macOS
brew install k6# Windows
choco install k6# Linux
wget https://github.com/grafana/k6/releases/download/v0.47.0/k6-v0.47.0-linux-amd64.tar.gz2. Create Your Performance Test Script
Create a comprehensive K6 test with both closed and open models:import http from 'k6/http';
import { check } from 'k6';
export let options = {
stages: [
{ duration: '30s', target: 10 }, // Ramp up to 10 users
{ duration: '1m', target: 20 }, // Scale to 20 users
{ duration: '30s', target: 0 }, // Scale down
],
thresholds: {
http_req_duration: ['p(95)<500'], // 95% requests under 500ms
http_req_failed: ['rate<0.1'], // Less than 10% failures
},
};
export default function () {
const response = http.get('http://your-api/catalog');
check(response, {
'status is 200': (r) => r.status === 200,
'response time < 500ms': (r) => r.timings.duration < 500,
});
}3. Create Spike Test Configuration
Test Black Friday scenarios with sudden traffic spikes:// Spike Testing - Black Friday scenarios
export let options = {
stages: [
{ duration: '10s', target: 100 }, // Below normal load
{ duration: '1m', target: 1000 }, // Spike to 1000 users
{ duration: '10s', target: 100 }, // Scale down
],
};Run Your Performance Tests
Execute your tests and analyze results:k6 run performance-test.jsk6 run spike-test.jsAnalyze Your Results
Export and analyze detailed performance metrics:k6 run --summary-export=results.json --out json=results.json performance-test.js- Request Volume: 28,154 requests processed successfully
- Throughput: 938 requests per second sustained
- Response Time: Average 5ms, P95 under threshold
- Error Rate: 0% failures during normal load
Understanding System Saturation
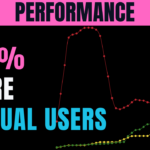
When you scale up to 50-100 virtual users, you'll discover:- Performance Cliff: Response times don't degrade gradually - they explode
- Breaking Point: 289 requests exceeded 500ms threshold
- Saturation Indicators: Check failures indicate maximum capacity reached
Advanced Testing Configurations
Open Model Testing
Test specific request rates regardless of user count:export let options = {
scenarios: {
constant_request_rate: {
executor: 'constant-arrival-rate',
rate: 100, // 100 requests per second
timeUnit: '1s',
duration: '2m',
preAllocatedVUs: 10,
maxVUs: 50,
},
},
};Endurance Testing
Test sustained load over extended periods:export let options = {
stages: [
{ duration: '2m', target: 100 }, // Ramp up
{ duration: '3h', target: 100 }, // Stay at load for 3 hours
{ duration: '2m', target: 0 }, // Scale down
],
};Clean Performance Data
When analysis is complete, clean up test data:rm results.json *.logWhat You've Achieved
✅ Performance Baseline - Know your system's current capacity limits ✅ SLA Validation - Verify response time requirements under load ✅ Breaking Point Discovery - Find where performance degrades before users do ✅ Automated Testing - Reproducible performance validation in CI/CDResources & Code
All K6 test scripts and configurations are available in my GitHub repository: ✅ IggyCloud/resourcesNext Steps: Adding Observability
This testing approach reveals performance limits but not root causes:- CPU Bottlenecks - Is processor utilization the limiting factor?
- Memory Issues - Are you hitting RAM limits or memory leaks?
- Database Performance - Is your data layer the bottleneck?
- Network Constraints - Are network resources saturated?


